Amherst College Statistics and Data Science Colloquium Series (2022-2023)
Wednesday, October 19, 2022
Simple Ways to Interpret Effects in Modeling Binary and Ordinal Data
Alan Agresti (University of Florida)
Probability-based effect measures for models for binary and ordinal response variables can be simpler to interpret than logistic (and probit) regression model parameters and their corresponding effect measures, such as odds ratios. For describing the effect of an explanatory variable while adjusting for others in modeling a binary response, it is sometimes possible to employ the identity and log link functions to generate simple effect measures. When such link functions are inappropriate, one can still construct analogous effect measures from a logistic regression model fit, based on average differences or ratios of the probability modeled or on average instantaneous rates of change for the probability. Simple measures are also proposed for interpreting effects in models for ordinal responses based on applying a link function to cumulative probabilities. The measures are also sometimes applicable with nonlinear predictors, such as in generalized additive models. The methods are illustrated with examples and implemented with R software. Parts of this work are joint with Claudia Tarantola and Roberta Varriale.
Wednesday, October 26, 2022
A guided walk through object oriented statistical machine learning
Johan VanHorebeek (CIMAT)
Usually, we treat data as vectors stored in an excel sheet or data matrix. In this talk we navigate attendees through a spectrum of challenging problems in data science and machine learning that show the need for more sophisticated approaches. We briefly discuss some (recent) mathematical and statistical aspects and the central role of distance and similarity functions.
Thursday, March 23, 2023
Problematic Polls and Suspect Surveys: Assessing the Potential for Selection Bias and Nonresponse Bias
Rebecca Andridge (The Ohio State University): this talk was also part of the Connecticut Valley Colloquium Series
Pre-election polls that missed the mark. COVID-19 vaccination surveys that drastically overestimated vaccine uptake. Accurately measuring public opinion and behavior is becoming more and more challenging with declining response rates and increased costs. One often overlooked possible explanation for inaccurate polling or questionable survey estimates is the possibility of non-ignorable nonresponse or non-ignorable sample selection, that is, that whether or not a person participates in a poll or survey is a function of characteristics the survey is trying to measure. For example, likely voters who support a particular candidate might be less likely to answer a telephone poll about voting intention, or adults who are “anti-vaccine” might be less likely to respond to a survey about the COVID-19 pandemic and its impact on their lives. In this talk I will describe using a statistical methodology called proxy pattern-mixture models to estimate the potential impact of nonignorable nonresponse or nonignorable selection in polls and surveys. The method will be motivated by and illustrated on a set of pre-election polls in “swing” states conducted by ABC and the Washington Post in 2020 as well as two very large internet-based probability surveys (Delphi-Facebook, Census Household Pulse) that drastically overestimated COVID-19 vaccine uptake in the U.S. in early 2021. I will describe the data and assumptions necessary to implement the method and discuss challenges unique to each application. My hope is that future polls and surveys could use this methodology to provide additional bounds on published estimates, especially when sample sizes are very large and traditional confidence intervals are very small.
Monday, February 27, 2023
Institutional Design and Policy Volatility in the American States
Scott LaCombe (Smith College)
This project incorporates policy volatility to our understanding of the relationship between public opinion and policy. There has been considerable research on the factors that strengthen or weaken policy responsiveness, but far less attention paid to the variability in the size and speed of changes in policy. Some states have remained relatively stable in their ideological trajectory or see incremental changes, while other tend to see large, sudden swings in policy, particularly when new actors take control of a government. Given increasing levels of polarization between Republicans and Democrats, there are growing fears of policy leapfrogging voters and governments oscillating from being too conservative to too liberal. I argue a way to understand policy representation and responsiveness is to model just mean changes in policy, but also to incorporate the variance of policy changes to understand what causes some states to see large shifts in policy, while others remain relatively stable. I use a heteroskedastic regression to estimate responsiveness and policy volatility in the states and find that institutional configurations that prioritize a strong checks and balance system can keep states more tightly bound to public opinion, while others allow for more volatile policy outputs that may be less responsive to the average voter. Adding volatility into models of responsiveness is an important step in understanding what drives the relationship between public opinion and policy.
Thursday, February 9, 2023
Phenotyping childhood and adolescent obesity using behavioral, psychological, and familial data
Ruth-Gaelle St. Fleur (Brown University)
Current obesity research has been hampered by considering all people above a set BMI cut-off to have a homogeneous disease and by examining individual risk factors versus taking a person-centered integrated approach. Using data from the Growing Up Today Study, we aimed to use latent class analysis to identify distinct clinically meaningful obesity subtypes based on underlying biology, expressed behaviors, cognitions, and other established risk factors and correlates and to assess prospective association between the identified subtypes and weight gain in adulthood. Among females, in childhood and adolescence, we identified four phenotypes: 1) early puberty, 2) mothers with obesity, 3) high weight concerns, and 4) mixed. Only three of those phenotypes emerged among the males: 1) high weight concerns, 2) mothers with obesity, and 3) mixed. Patterns of weight gain in young adulthood varied by subtype of obesity, indicating that subtyping groups may offer clarity into the promotion of obesity. The next step in our current project is to examine whether the same phenotypes emerge in different samples of children and adolescents and whether they are the same across race and ethnic groups. We will also investigate how the subtypes are associated with risk of developing hypertension before age 35 and relate to the genetic risk score for obesity.
November 15, 2022
Reproducible Reporting with {gtsummary}
Daniel Sjoberg (Memorial Sloan Kettering Cancer Center)
The gtsummary package provides an elegant and flexible way to create publication-ready summary tables in R. A critical part of the work of statisticians, data scientists, and analysts is summarizing data sets and regression models in R and publishing or sharing polished summary tables. The gtsummary package was created to streamline these everyday analysis tasks by allowing users to easily create reproducible summaries of data sets, regression models, survey data, and survival data with a simple interface and very little code. The package follows a tidy framework, making it easy to integrate with standard data workflows, and offers many table customization features through function arguments, helper functions, and custom themes.
Background
Talks in the Statistics and Data Science Colloquium are free and open to the public. They are intended to be accessible to a broad audience with some background in statistics and data science. Junior and senior statistics majors are expected to attend talks in the SDS Colloquia. Please reach out to Professor Nicholas Horton in case of conflicts.
Logistics
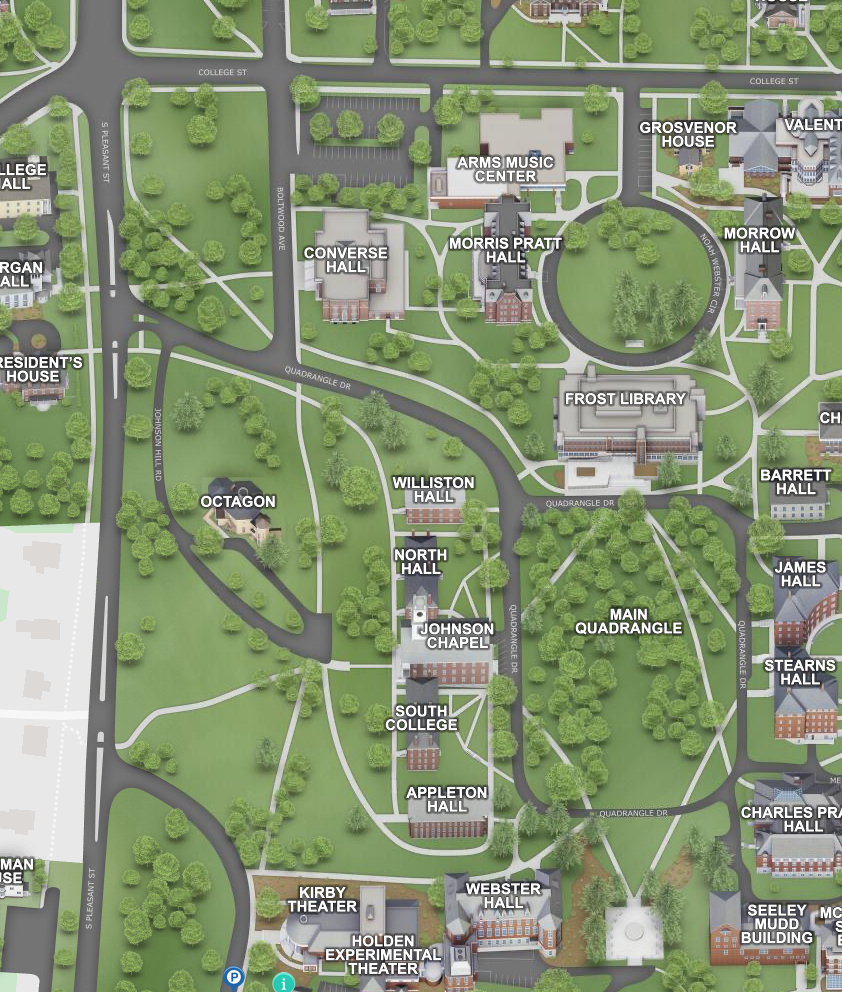
Seeley Mudd Hall is located at the southwest corner of the first year Quadrangle (31 Quadrangle Drive). Paid parking is available at the Amherst Town Common and Boltwood Drive (approximately 8 minute walk). PVTA Bus Service is available from the Converse Hall stop.
Copyright © 2025 Amherst College. All rights reserved.